Overview
The Anvil platform gives you a real-time view of what's happening inside your Control4 drivers. Events, logs, and errors stream in as they happen, so there's no guessing what your driver is doing and no digging through Composer's Lua output.
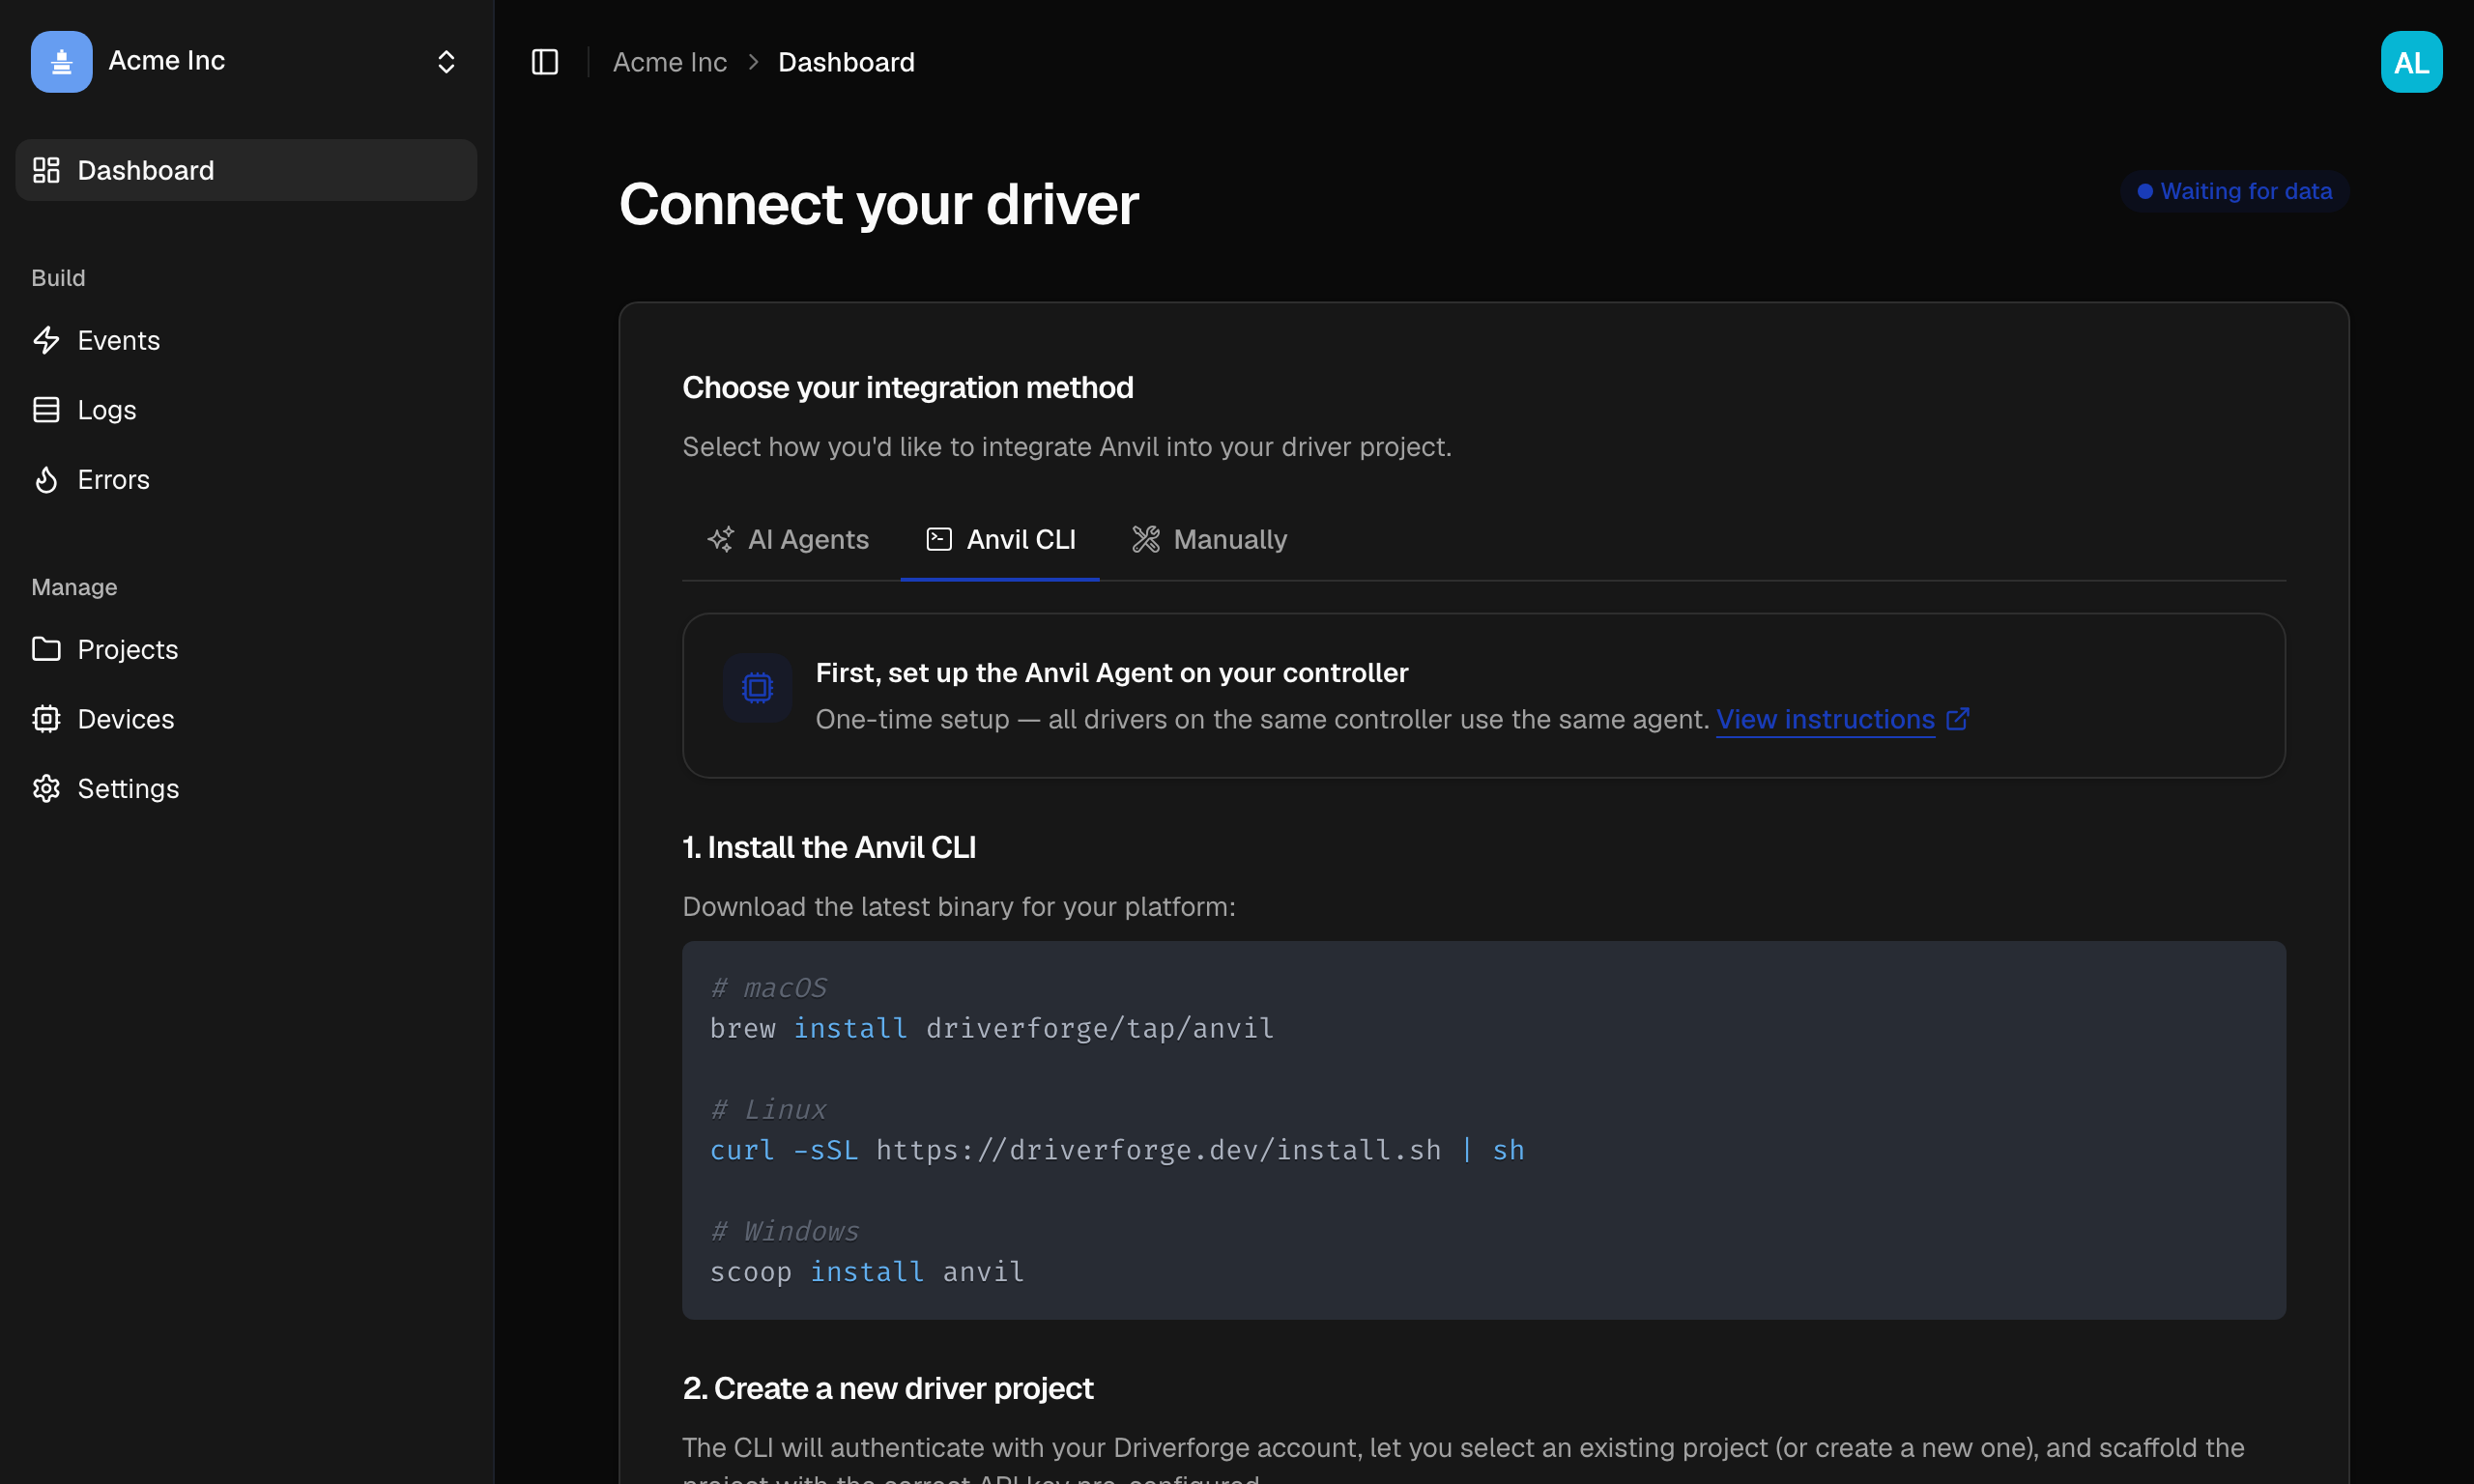
How Anvil is organised
Your organization is the scope you work in. Everything you open (the dashboard, events, logs, errors) covers the whole organization by default, and a project is a filter you apply on top rather than a place you navigate into. If you've used Sentry, this will feel familiar.
That means one stream per view instead of one per driver: you can watch every driver in the organization at once, then narrow to a single project when you want to focus. Each row carries a small badge naming the project and platform it came from, so a merged stream still tells you where each item originated.
The sidebar
The left sidebar is the same on every page:
- At the top, the organization you're currently in. Click it to switch organizations or add a new one.
- Dashboard, your organization's activity at a glance.
- Build, the three data views: Events, Logs, and Errors.
- Manage, shortcuts to Projects and Devices, plus Settings for everything else.
- At the bottom, your user menu: your own account settings, the light/dark theme, keyboard shortcuts, and links to the docs, community, and changelog.
Opening Settings swaps the sidebar for the settings sections (Organization, Manage, Third Party Access, and Billing), with a Back to your organization link at the top to return. You're either in the app or in settings; there are no nested layers of settings to get lost in.
The filter bar
Above the dashboard and each of the three data views sit two controls:
- The project filter, which narrows the view to one or more projects. Leaving everything selected (the default) shows the whole organization. Your selection is held in the page URL, so a filtered view is a link you can share. The dropdown also has a New project row, which is the quickest way to create one.
- The time range, covering 15 minutes through to 90 days, clamped to your plan's retention window, along with the pause button for the live stream.
What you get
Events
Every handler call your driver receives is captured automatically: OnPropertyChanged, ExecuteCommand, ReceivedFromProxy, and 100+ others. For each event you can see the exact arguments Control4 passed, how long your handler took to execute, and whether it succeeded or threw.
Logs
Forward your driver's log output to Anvil and see it in real time, persisted across driver reloads and Composer refreshes. Filter by level, search by message, and jump from a log entry to the event that produced it.
Errors
When your driver throws, Anvil captures the error with a full stack trace and groups identical errors together. See at a glance which errors are new, which are recurring, and how often each one occurs.
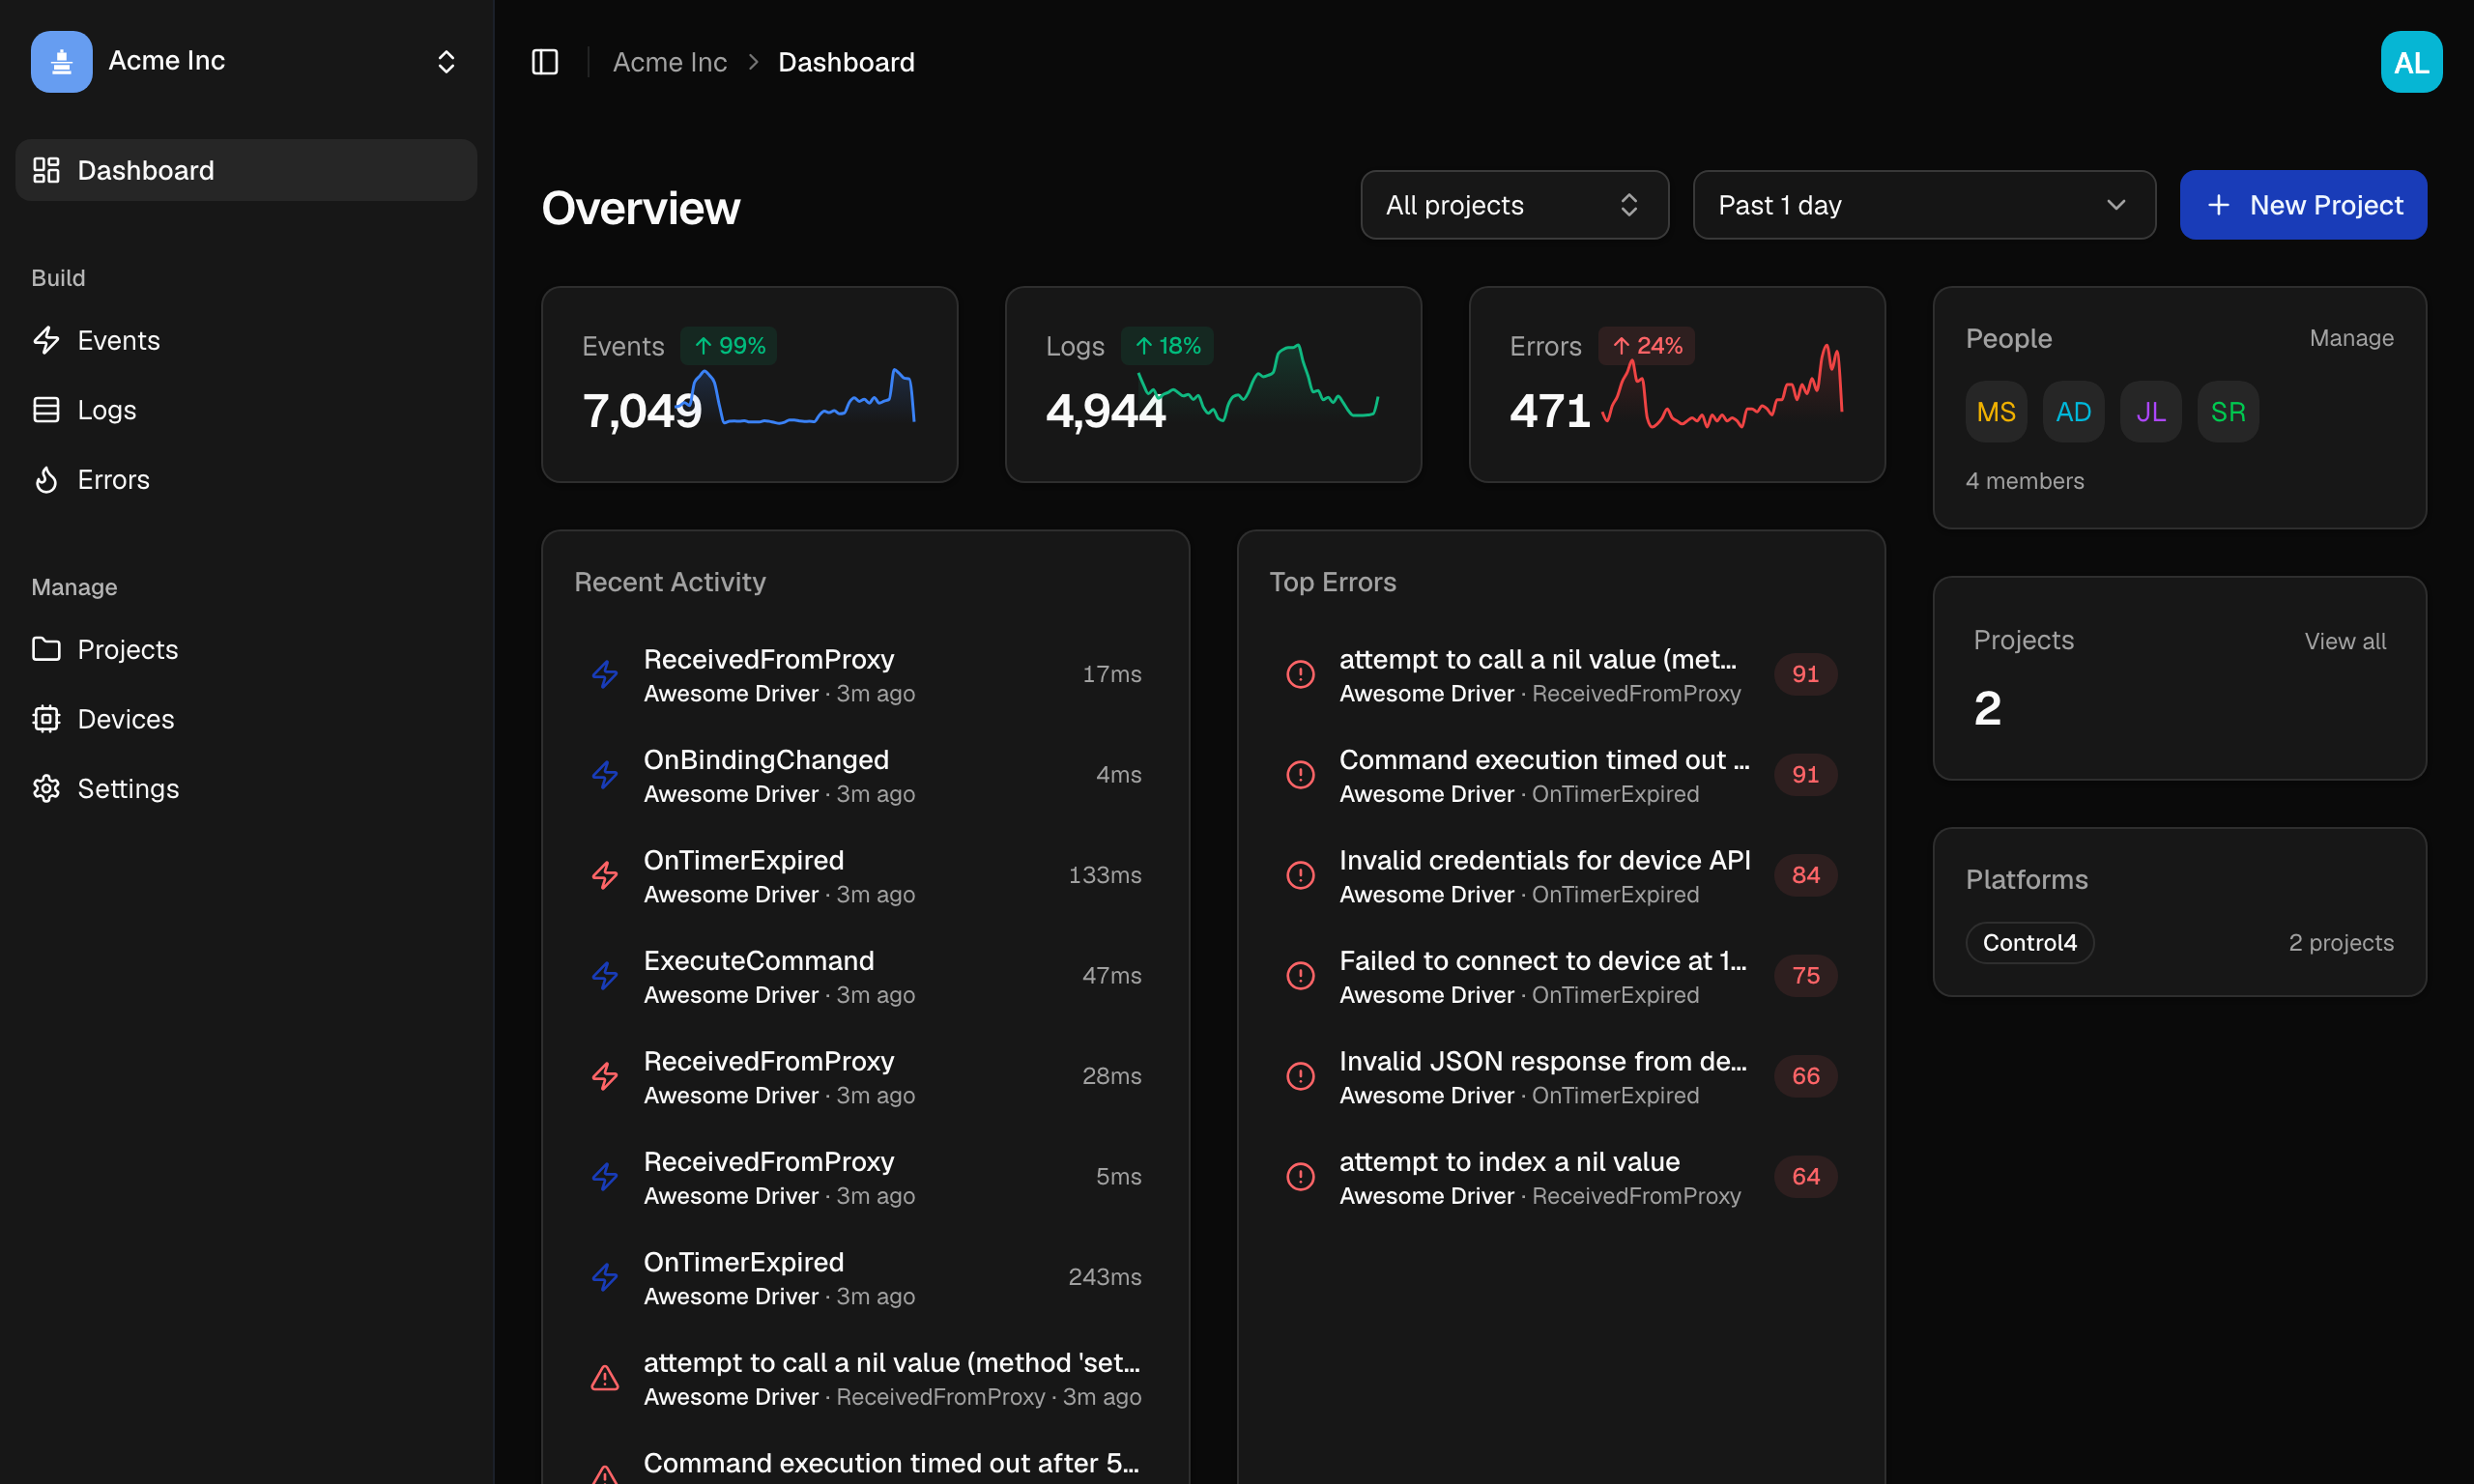
The dashboard
The dashboard is the organization's bird's-eye view, covering whatever the project filter has in scope:
- Events, Logs, and Errors totals for the selected time range, each with a sparkline and a change indicator against the previous period.
- Recent Activity, the latest errors and events as they arrive.
- Top Errors, ranked by occurrence count.
- People, Projects, and Platforms panels summarising the organization itself.
If you narrow the filter to a single project that has never received data, the dashboard shows that project's setup instructions instead of empty tiles, complete with its project token. It reverts to the usual dashboard as soon as data starts flowing.
Real-time streaming
All three views stream in via WebSocket. You can pause the stream to inspect something, and a badge shows how many items are buffering while paused. Click play to flush the buffer and resume.
Keyboard shortcuts
Press ? anywhere in Anvil for the full list. The essentials:
| Keys | Action |
|---|---|
? | Show keyboard shortcuts |
1 2 3 4 | Dashboard, Events, Logs, Errors |
j / k (or ↓ / ↑) | Move through the list |
Enter | Open the selected item |
Esc | Close a drawer or dialog |
Ctrl+Alt+1 … Ctrl+Alt+8 | Jump to a time range, 15 minutes through 30 days |
Ctrl+Alt+L | Play or pause the live stream |
On macOS, Ctrl+Alt is shown as ⌃⌥.
Managing your workspace
Beyond the data views, the platform is where you manage everything around your drivers:
- Organizations, your top-level workspace, with members & roles
- Projects, one per driver, each with its own project token
- Devices, the controllers you deploy to
- Subscription and payment, covering your plan, usage, and cards