Logs
The Logs page (titled Log Explorer in the app) shows all log output from your drivers in real time. Filter by level, search by message content, and pick up right where you left off: logs persist across driver reloads, so there's no need to keep Composer Pro's Lua tab open.
To learn how to forward logs from your driver to Anvil, see Log Forwarding in the SDK section.
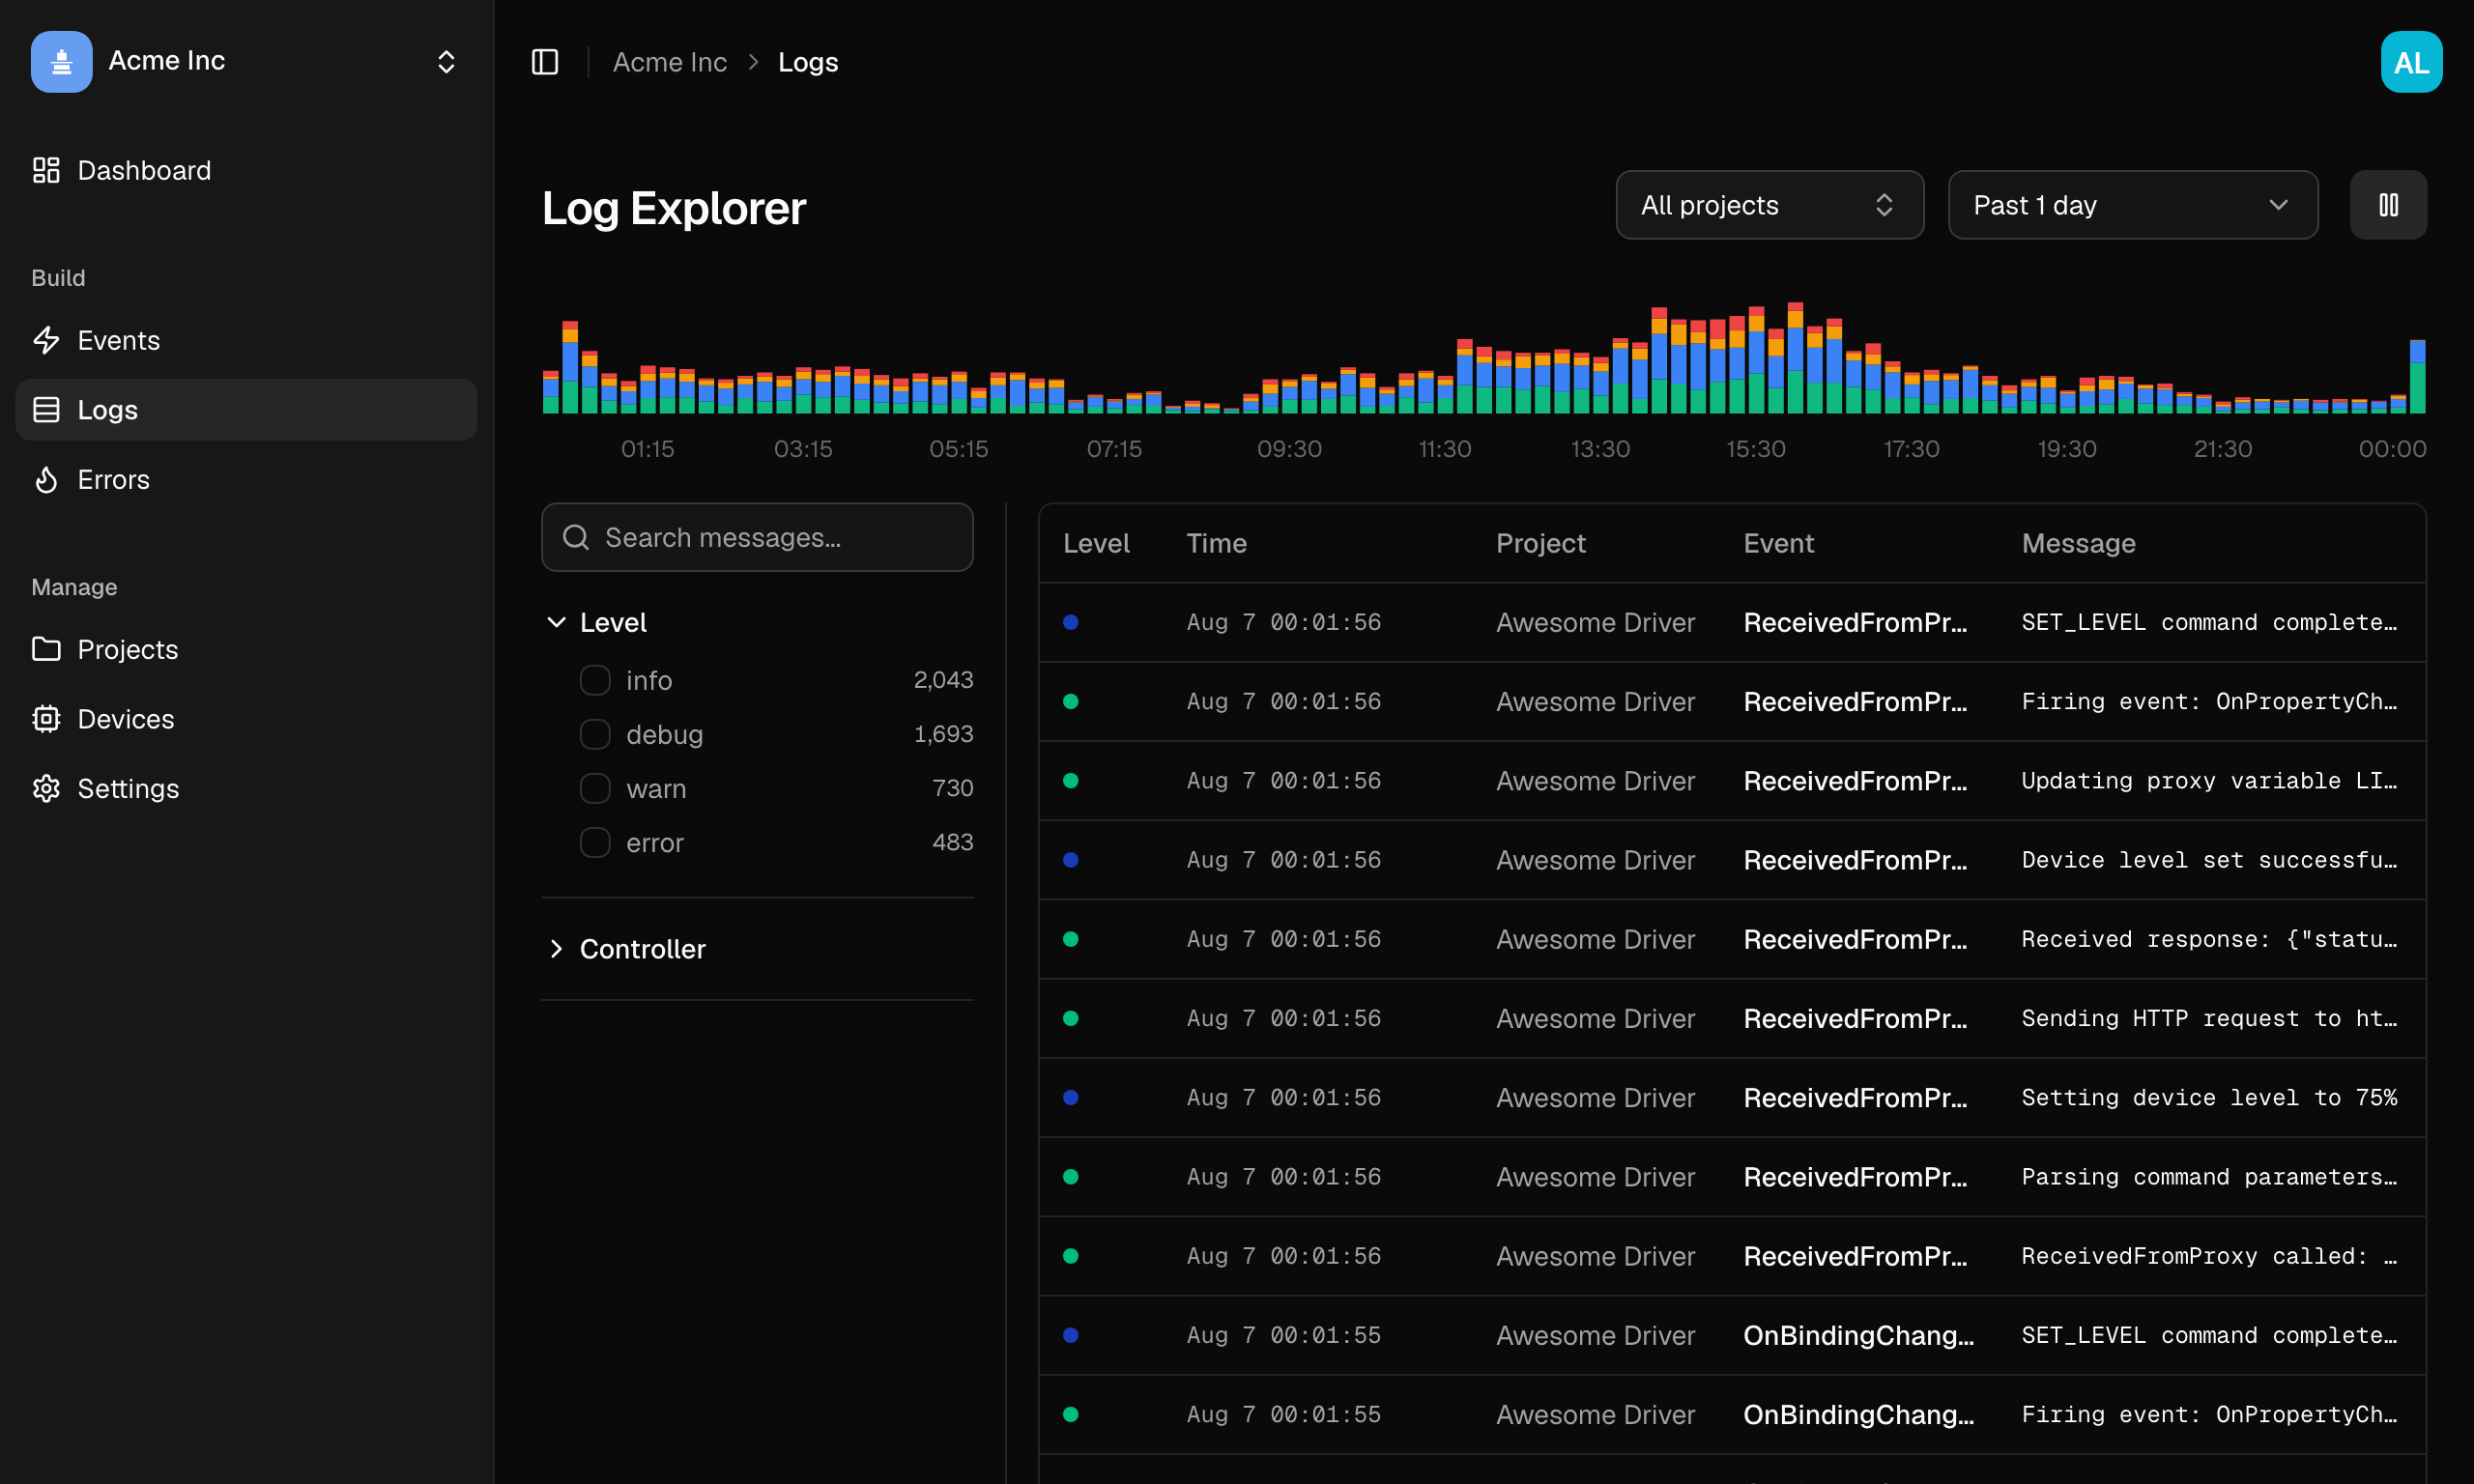
The page covers every project in your organization. Use the project filter at the top to narrow it to one driver. See Managing projects for how the filter works.
Real-Time Log Stream
Logs stream in as they happen. Each row shows:
- Level, a coloured indicator (red for error, amber for warn, blue for info, green for debug, grey for trace)
- Time, when the log was recorded (hover for the full timestamp)
- Project, which project the log came from, so a merged stream still tells you which driver logged it
- Event, the linked event name, if the log was captured during an event handler
- Message, the full log message
To find which controller a log came from, use the Controller facet or open the log's detail drawer.
Pause and Resume
Click the pause button to freeze the stream while you read through logs. Events continue buffering in the background, and a badge shows how many are waiting. Click play to flush the buffer and resume.
Log Detail
Click any log row to open the detail drawer.
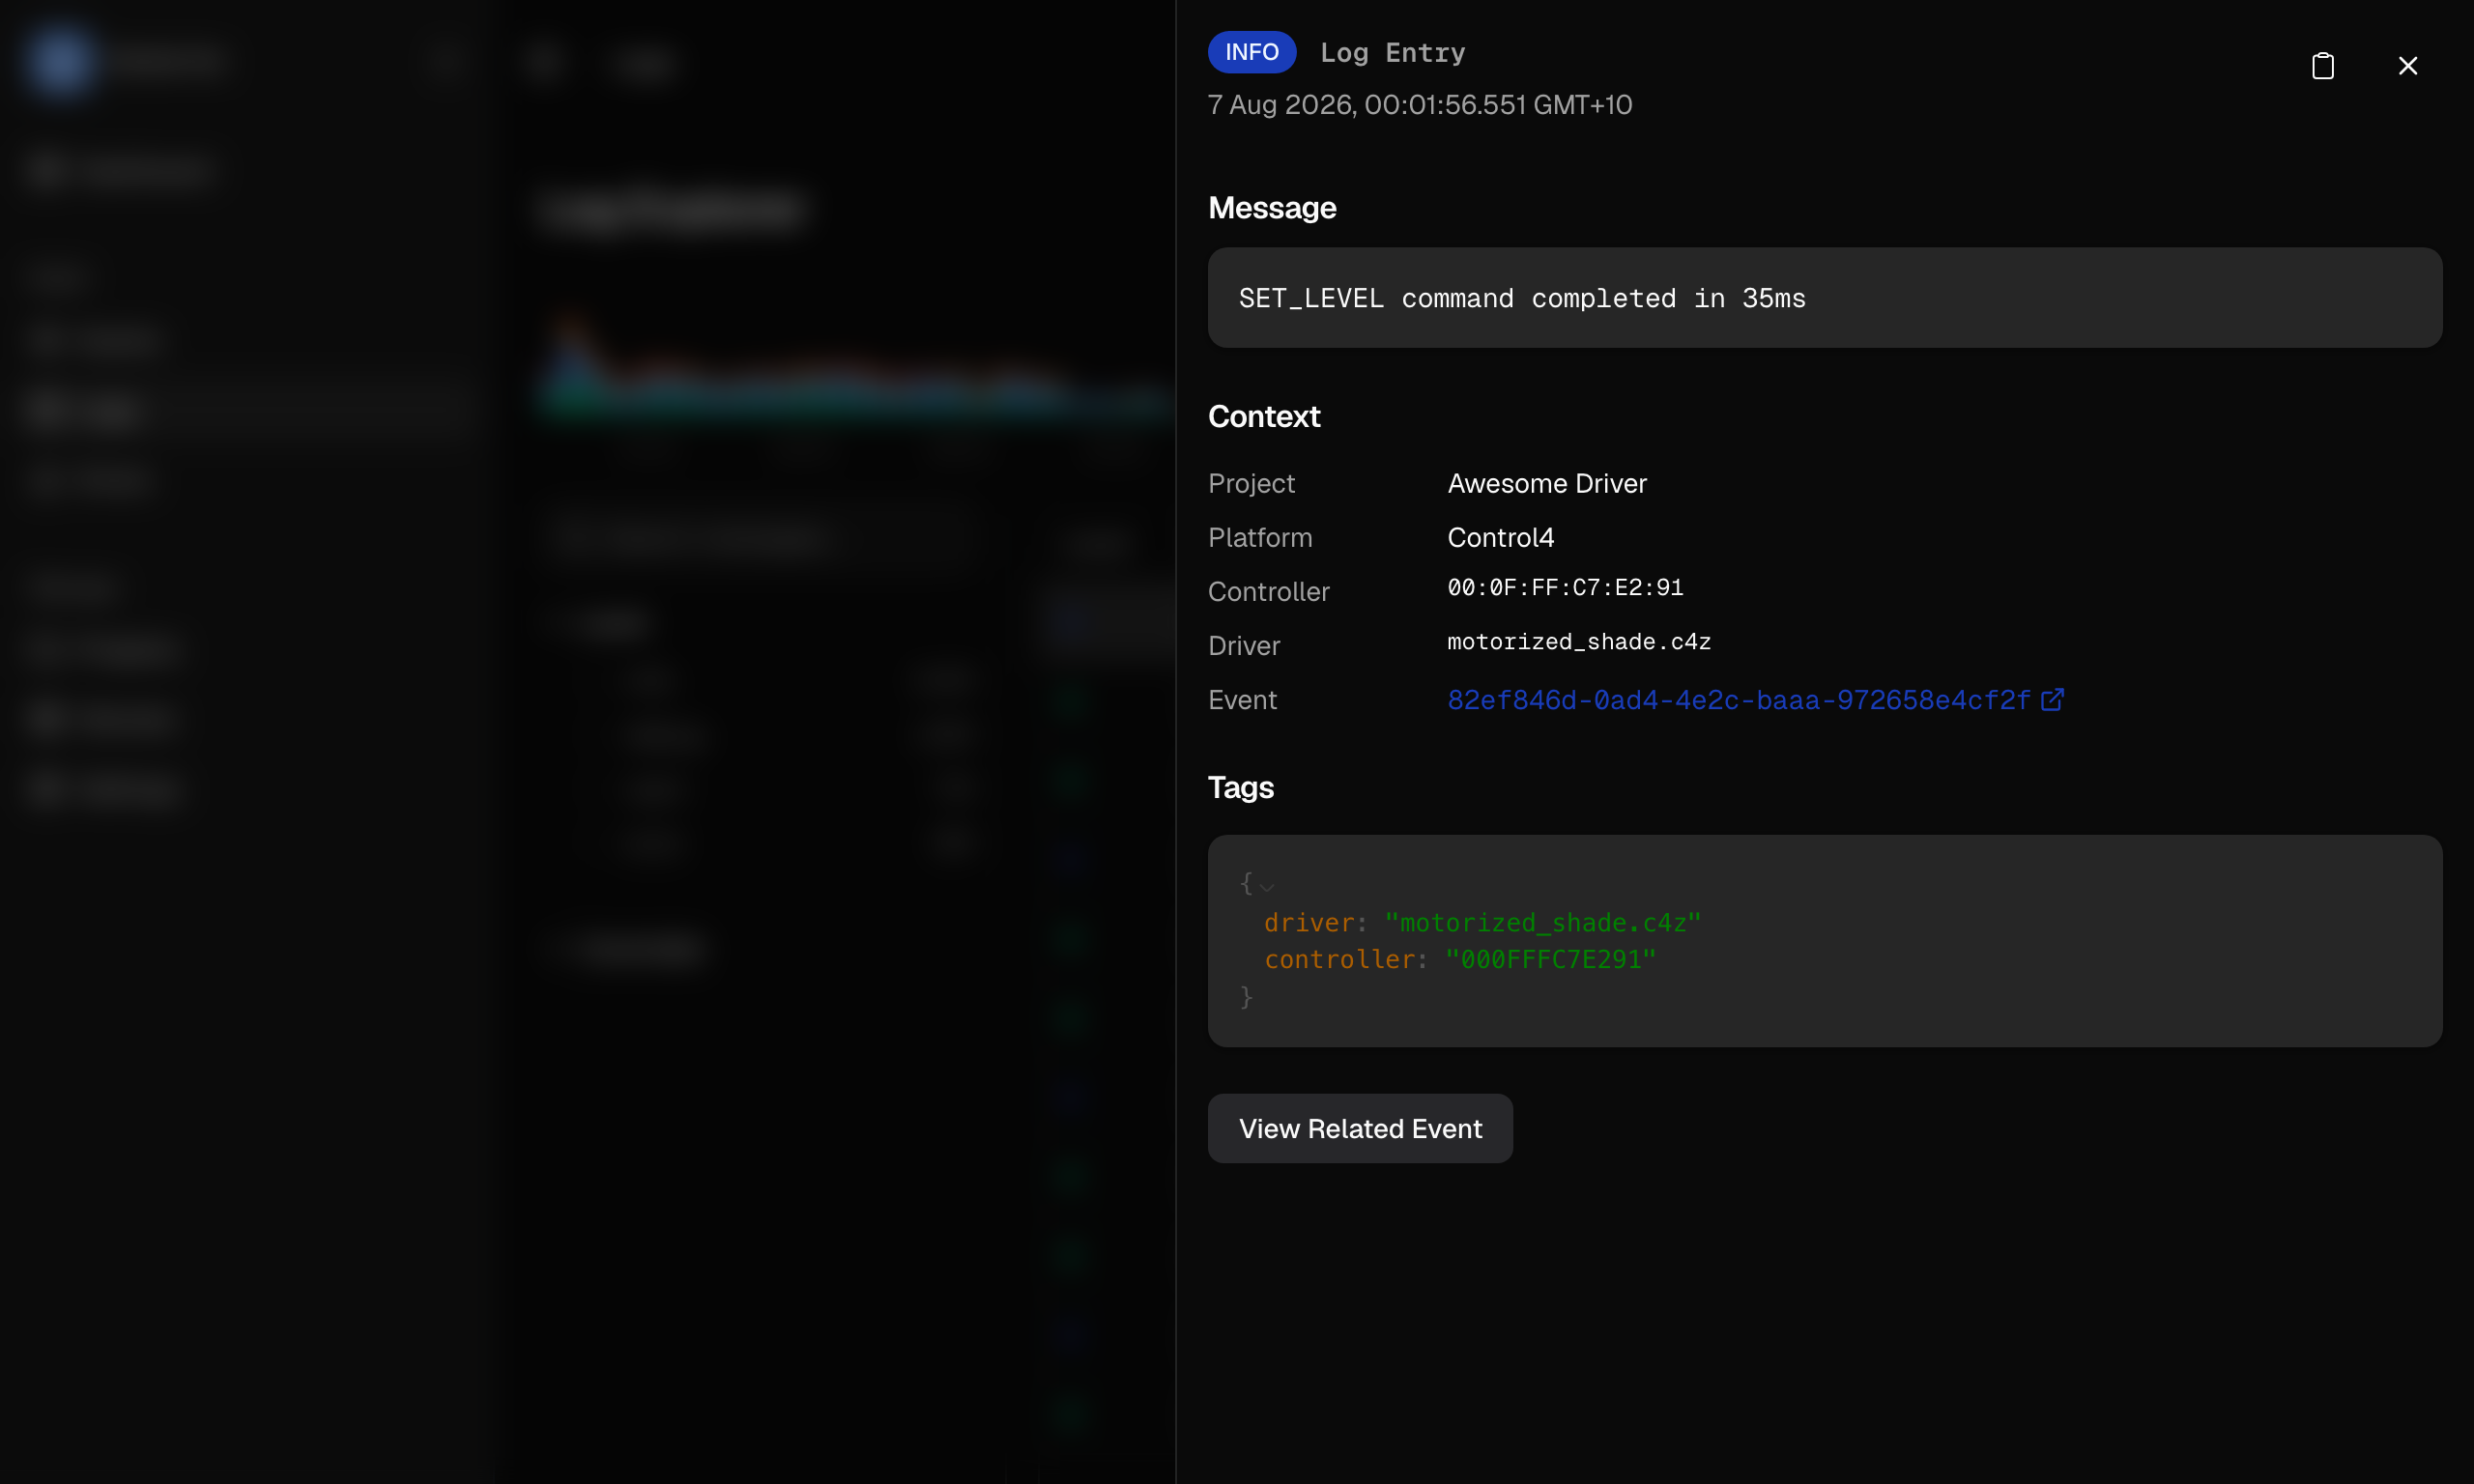
The detail drawer shows:
- The level badge and the full timestamp
- Message, the complete log message (selectable for copying, with a copy button in the header)
- Context: the project, platform, controller, and driver the log came from, plus the event that was executing
- Tags, any key-value pairs attached to the log, as JSON
- View Related Event, if the log was captured during an event handler, to jump to that event (see Logs vs Events)
Histogram
A bar chart above the log list shows log volume over time. Hover for a breakdown by level with counts. The histogram adjusts its bucket size based on the selected time range.
Filtering
Projects
The project filter narrows the stream (and the histogram and facet counts along with it) to the projects you tick. Your selection is held in the URL, so a filtered view is a link you can share.
Time Range
Select from preset ranges: 15 minutes through to 90 days, clamped to your plan's retention period.
Message Search
Search for logs containing specific text. The search is a substring match with a short debounce, so results update as you type. Message search is available on all plans.
Facets
Filter by multiple dimensions, each showing a count so you can see the distribution at a glance:
- Level, one of Error, Fatal, Warn, Warning, Info, Debug, or Trace
- Controller, shown as a formatted MAC address
Facet filtering (Level and Controller) is available on paid plans. Message search and basic log streaming are available on all plans.
Keyboard Navigation
j/k(or↓/↑) to move down and up through logsEnterto open the selected log's detail drawer, andEscto close it
Press ? for the full shortcut list.