Errors
The Errors page groups exceptions thrown by your drivers so you can focus on unique issues rather than wading through duplicates. Each error group shows how often it occurs, when it was last seen, and a trend sparkline.
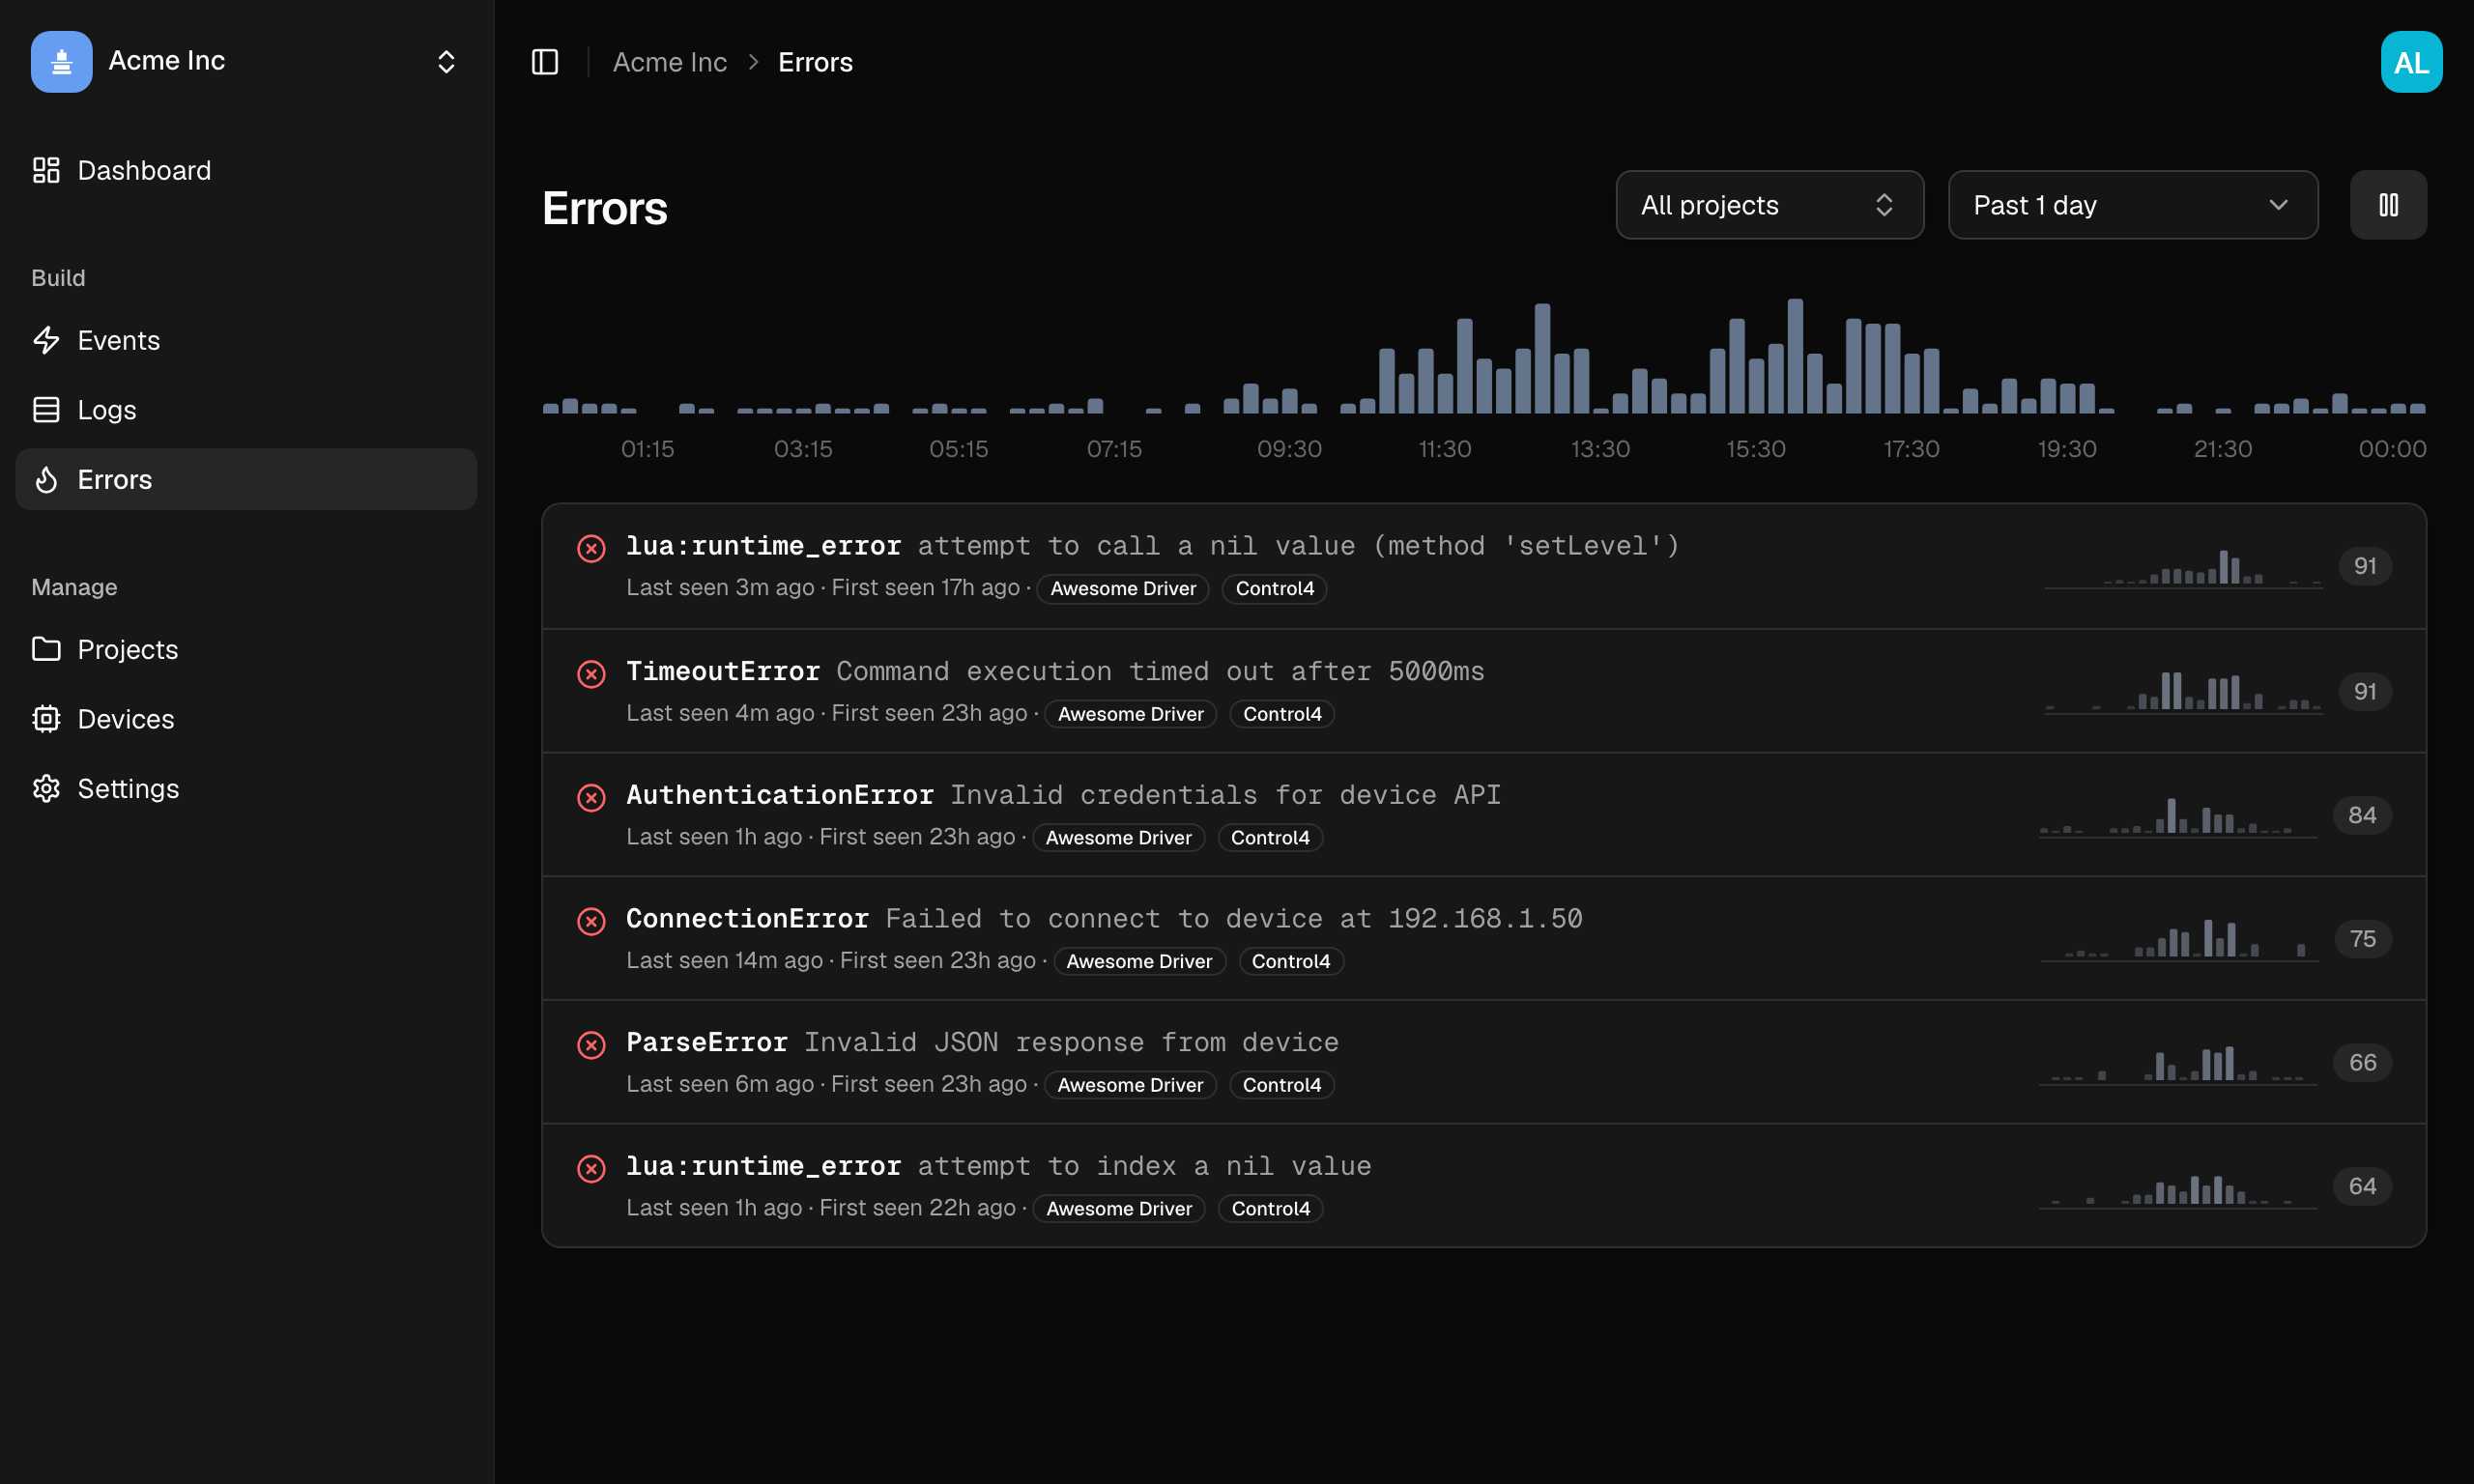
The page covers every project in your organization. Use the project filter at the top to narrow it to one driver. See Managing projects for how the filter works.
Error Groups
Errors are automatically grouped by their fingerprint (see Error Grouping for details). Each row in the list shows:
- The error type (for example
LuaError) and its value, the error message - Last seen and First seen, both relative, with the full timestamp on hover
- Badges naming the project and platform the error came from
- A trend sparkline of occurrence frequency across the selected time range
- A count of total occurrences
This lets you quickly see which errors are frequent, which are new, and which are trending up or down.
Error Detail
Click an error group to open the detail page.
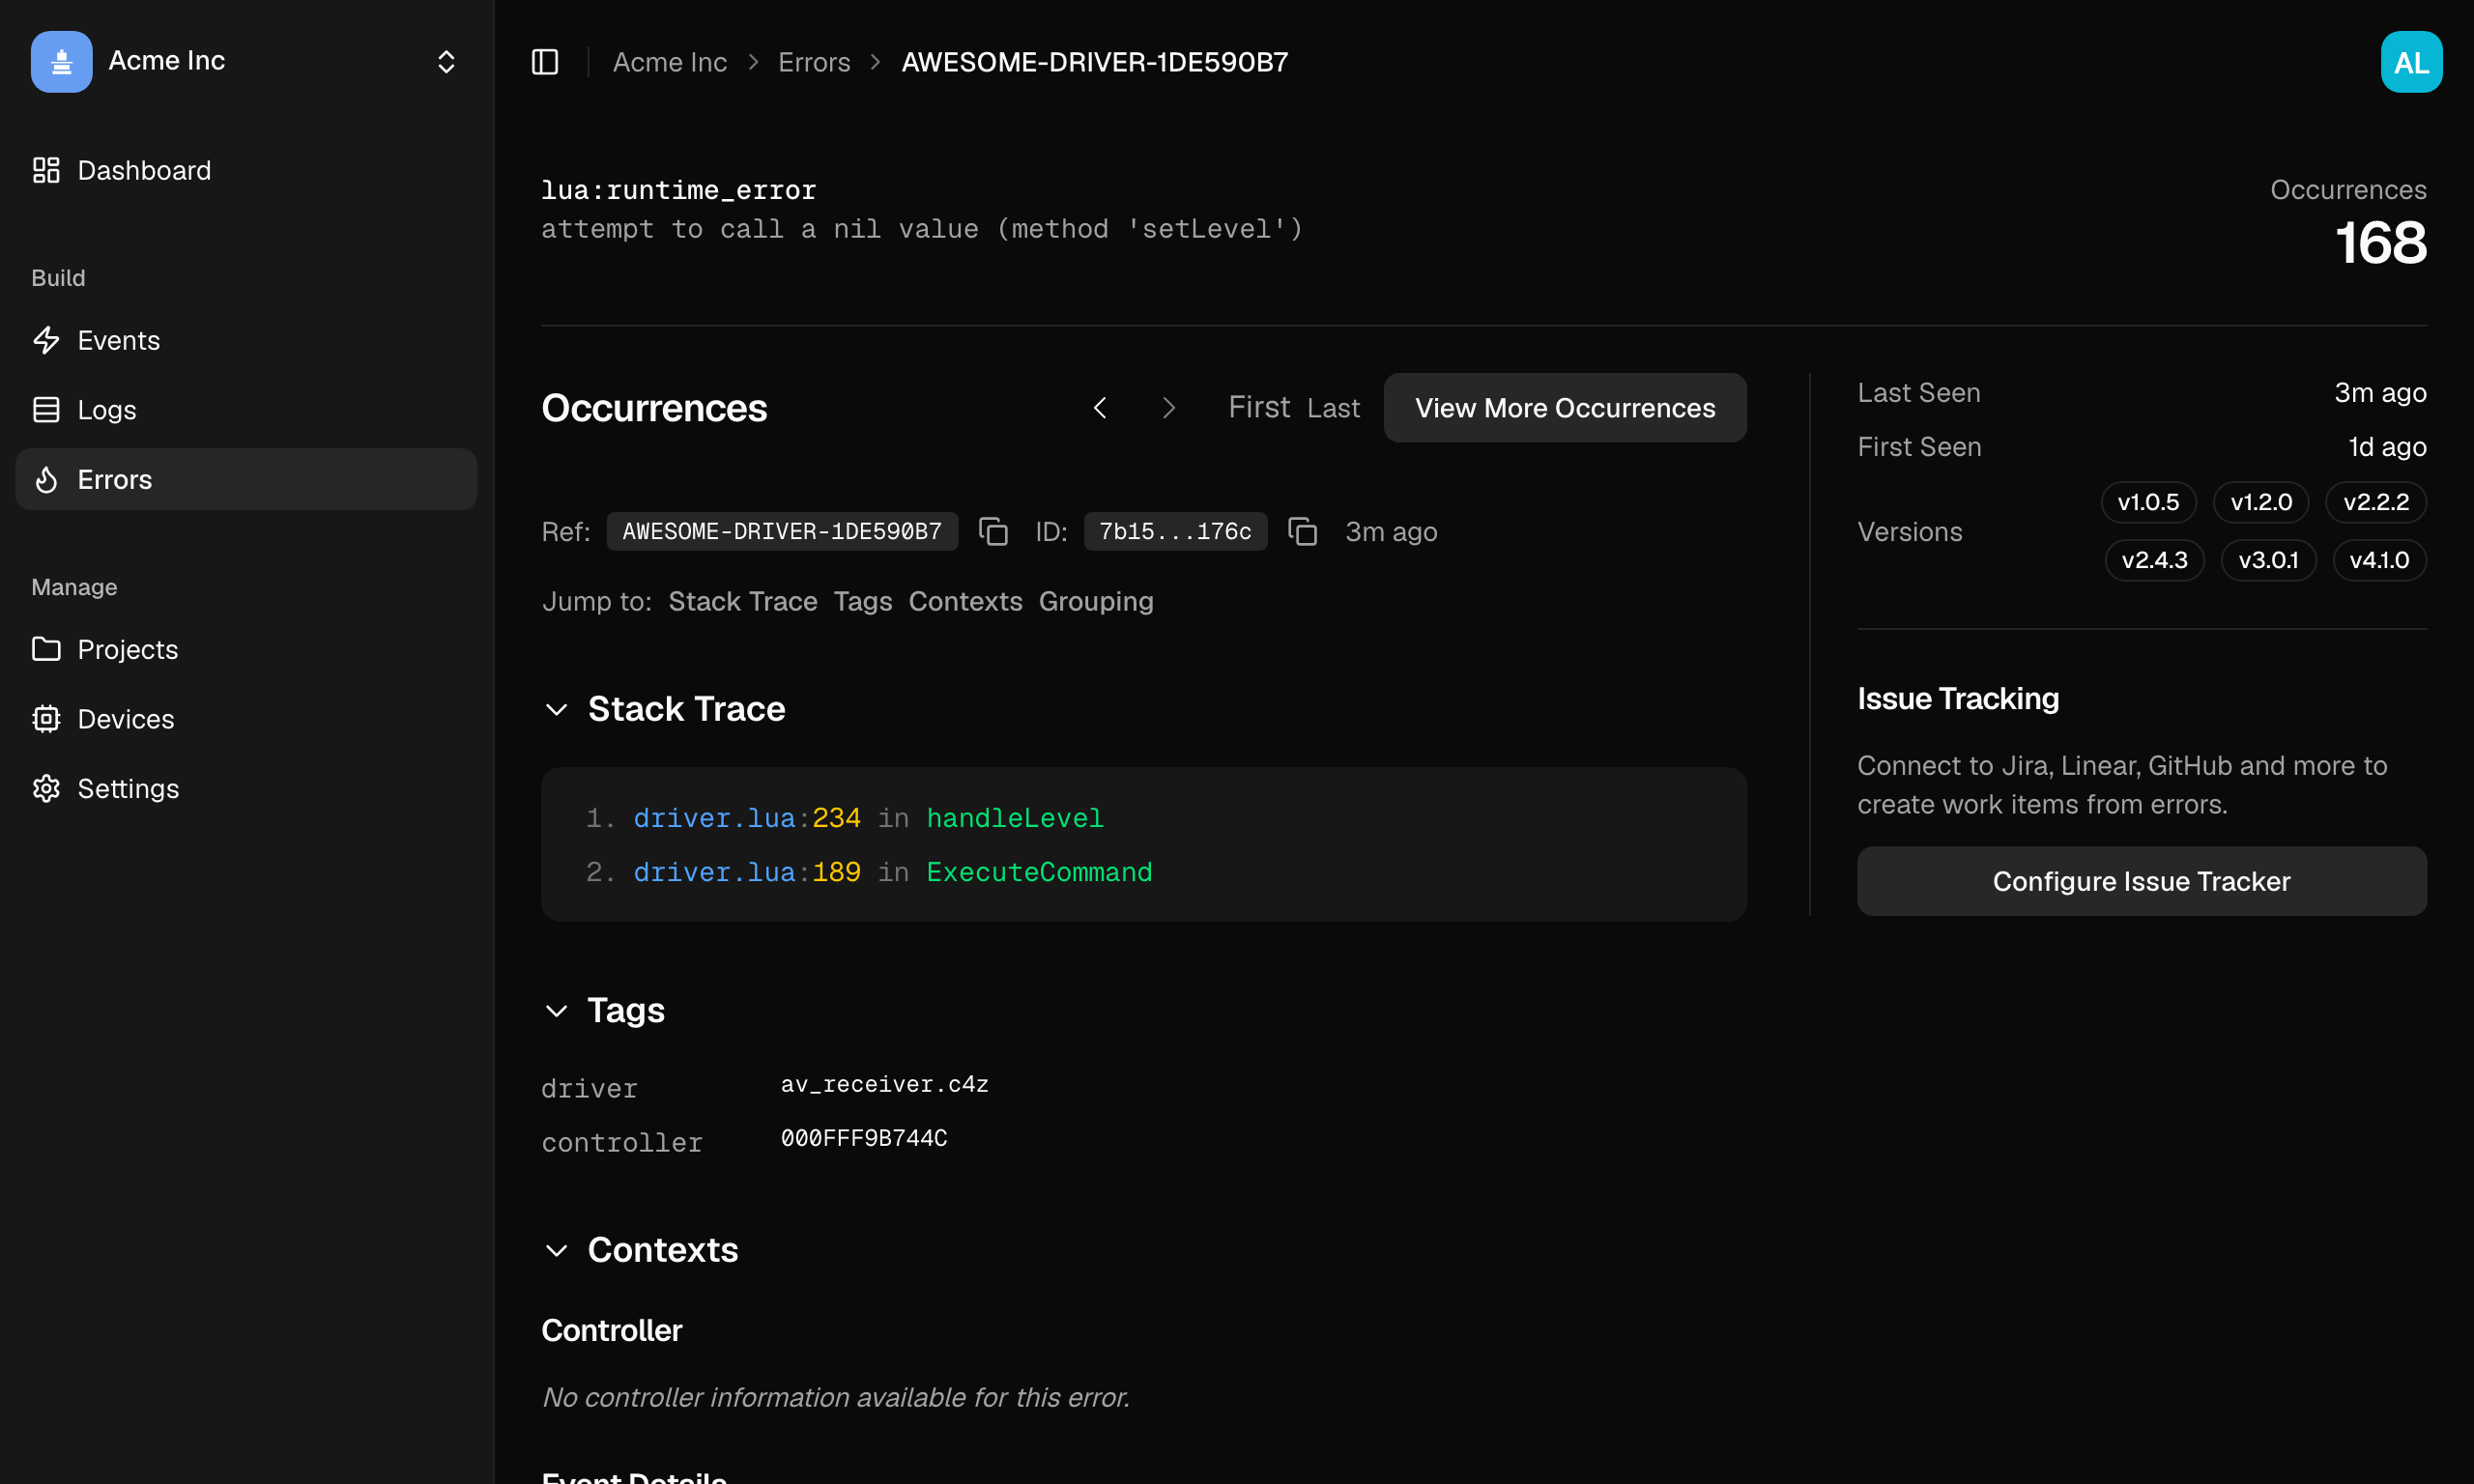
This gives you everything you need to diagnose the issue:
Stack Trace
A formatted, syntax-highlighted view of the call stack showing file names, line numbers, and function names. If you've uploaded source maps, the stack trace maps back to your original source files rather than the bundled output.
Occurrences
A table of every individual occurrence of this error, showing:
- Error ID: unique identifier (click to view that specific occurrence)
- Timestamp: when it happened
- Message: the error message for this occurrence
- Version: the driver version that produced it
Navigate between occurrences using the Previous / Next buttons, or jump to the first or last occurrence.
Sidebar
Alongside the stack trace, a sidebar summarises the group: when it was last seen and first seen, and which driver versions have produced it. It also has a shortcut to configure an issue tracker, so errors can become work items in Jira, Linear, GitHub, and similar tools. That integration is still in development; see Managing your organization.
Context
Expandable sections below the stack trace:
- Tags, key-value pairs attached to the error
- Contexts, the full JSON payload from the error context
- Event Grouping Information, the fingerprint strategy, hash, and raw grouping data used to identify this error group (collapsed by default)
Histogram
A bar chart above the error list shows error volume over time. Hover for counts at each time bucket. The histogram adjusts automatically based on the selected time range.
Real-Time Streaming
New errors stream in via WebSocket. When a new occurrence of an existing error arrives, the group's count, last seen, and sparkline update in place. New error groups appear at the top of the list.
The same pause/resume controls from Events and Logs are available: pause the stream to inspect, and a badge shows how many errors are buffered.
Automatic Capture
Errors in event handlers are captured automatically. You don't need to add any error handling code; just add the Driverforge SDK and errors appear in Anvil.
Note that errors in C4:SetTimer and C4:url() callbacks need manual instrumentation because C4 is a protected userdata object. See Manual Capture for details.
Keyboard Navigation
j/k(or↓/↑) to move down and up through error groupsEnterto open the selected error's detail page
Press ? for the full shortcut list.